Select Image to Launch Demo
This week’s ELHChallenge is to present data using interactive charts and graphs. With just 4 days until Christmas, I succumbed to the theme.
 What to Chart?
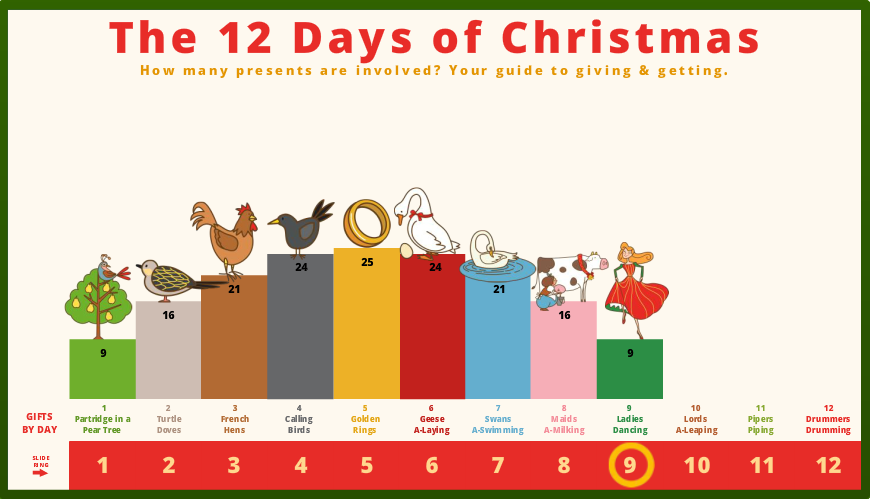
There are a million Christmas-related things you could present, but I kept it light and charted the gifts given in the song The 12 Days of Christmas. I’ve never paid much attention to the totals in it, so the sheer mass by the end was a little eye-opening.
 How to Chart It?
I went for a simple slider that lets the user choose the day and see the resulting total for all gifts given to that point. I tried to provide enough visual interest and information to make the concept clear – but it does assume familiarity with the song.
 The Gift of a New Challenge Year
I’m hopeful that none of us give or get quite this many gifts, but I’m looking forward to the gift of a whole new year’s worth of ELHChallenges – and I hope you are too!
I love it Jackie! I’ve also been working away on a “12 days of Christmas” demo – but mine is very different to yours! I just posted it on #21 challenge on the e-Learning Heroes community.
Thanks Dianne – I loved your Aussie version, too! There were a lot of very cute guys in there.
That’s really neat. I never thought about using sliders to teach math.
Thanks, Dan! This was a quickie demo, but it does touch on the math-and-sliders idea.
That’s pretty fabulous, Jackie. I always love your creativity.
Thank you, Kimberly! :)
Love the concept Jackie. Just wanted to let you know that I was recently asked “What makes a person an eLearning Hero?” I named off a couple characteristics and ended my statement with “Jackie”. She’s who embodies an eLearning Hero to me :) Hope you had a Merry Christmas :)
Hi Jennifer! Well, I don’t know if you intended to make my year with that one, but you just did. Thank you so, so much. :)
I hope you had a wonderful Christmas too! I’m looking forward to another year of ELH fun and I hope you are too. Happy new year!!
That’s a pretty creative way to meet the challenge. Well done!
Thank you, Jacqueline!